The 2026 Oil Black Swan No One Saw Coming
And the Four Doom Loops It Just Activated
Brent crude trades at $107 today. Physical crude landing at Rotterdam this week is changing hands above €140 a barrel — a 43% premium the futures benchmark doesn't show.
Most readers feel something is wrong with the oil market. Pump prices are climbing, jet-fuel arrivals into Europe collapsed 82% month-on-month in April, and the IEA's May 2026 Oil Market Report quietly recorded the largest two-month global inventory draw of the post-war era. Yet the headline number — Brent — looks almost orderly. Reuters this week called it a "deceptive calm."
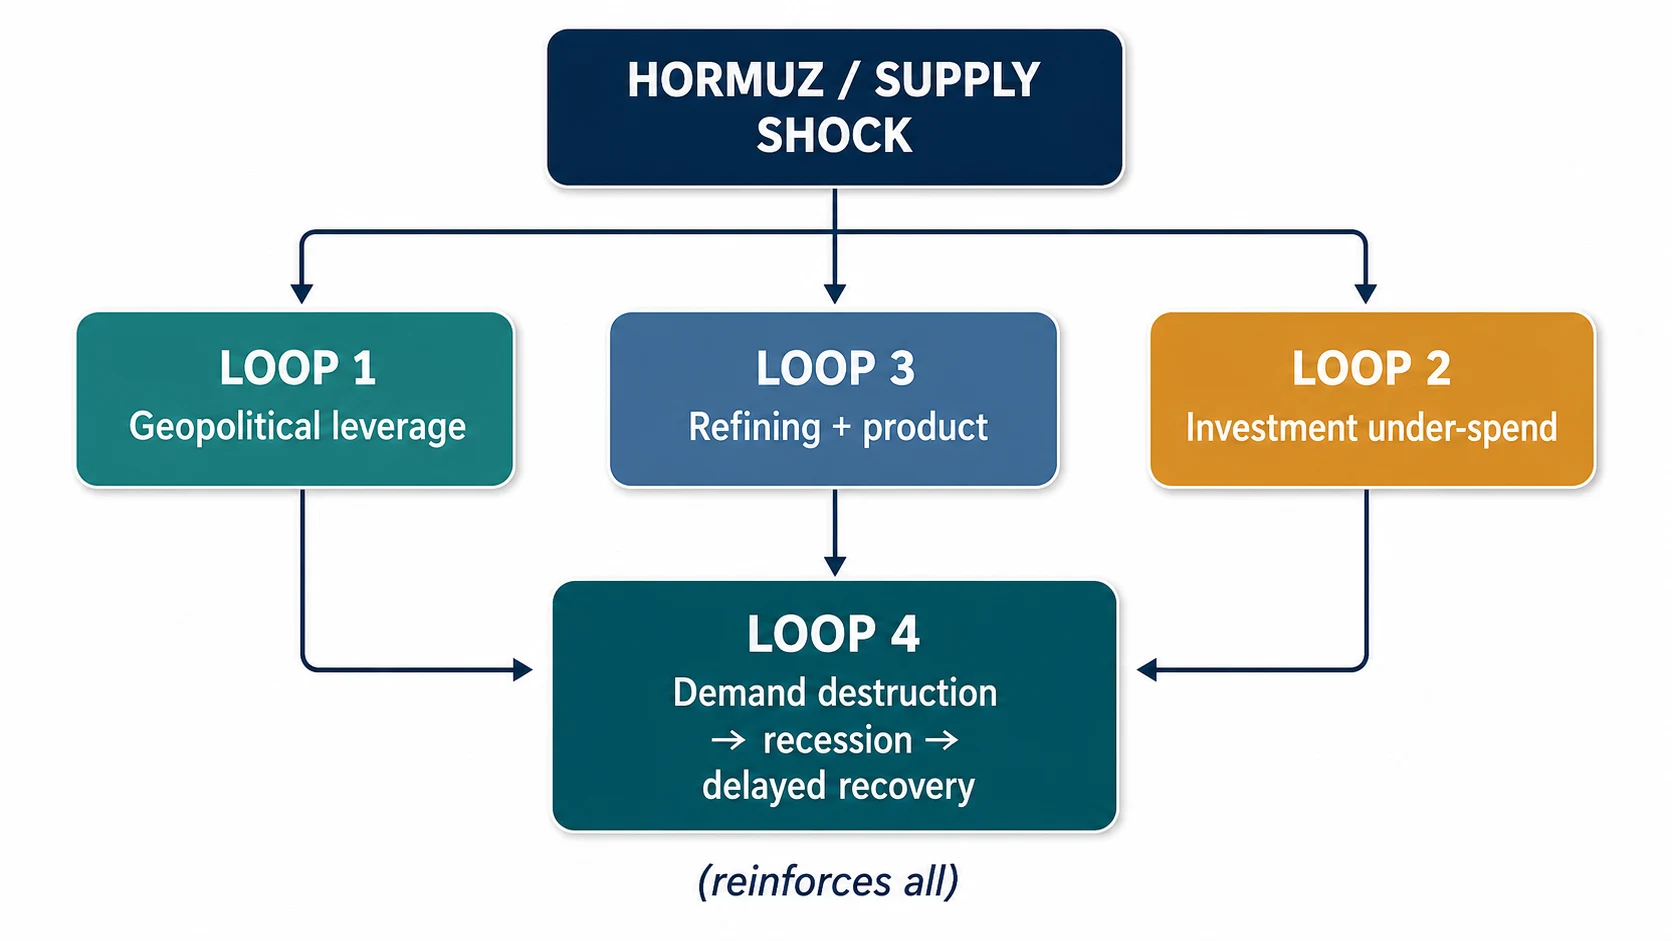
The calm is the story. Black swans don't arrive out of nowhere; they arrive when a brittle system finally reveals itself. The 2026 crunch isn't four shocks running in parallel — it's one shock that has set four feedback loops in motion. Once you can see the loops, the headlines decode.
The black swan that wasn't random
In late 2025, mainstream forecasts converged on the same view: 2026 would be an oversupplied year. J.P. Morgan modelled a glut, the EIA's Short-Term Energy Outlook projected Brent in the $60s, and the IEA's December Oil Market Report described a market that would "comfortably absorb" any incremental disruption. The consensus was that demand growth had peaked, US shale was filling any gap, and OPEC+ would unwind production cuts gradually into a soft market.
That consensus was demolished in roughly ten weeks.
The proximate cause was the February 2026 Iran–Israel–US confrontation. The Strait of Hormuz was functionally closed for most of March, briefly reopened on 17 April, and was reclosed within 24 hours on 18 April when Iran determined that the US had not lifted its blockade on Iranian ports as required under the diplomatic resolution. Strait traffic has run at roughly 14% of its pre-crisis baseline since.
The damage already on the IEA's books, as of the May 2026 Oil Market Report:
- Output from Gulf countries affected by the Strait closure is 14.4 million barrels per day below pre-war levels.
- Cumulative Gulf-producer supply losses since the war began had exceeded 1 billion barrels by mid-May.
- Global observed oil inventories fell by 246 million barrels across March and April — the largest two-month draw on record.
- The IEA's full-year 2026 balance now implies an average global supply deficit of around 1.8 million barrels per day — Reuters calculated the gap at 1.78 mb/d from the report's demand (104.0 mb/d) and supply (102.2 mb/d) figures. The near-term picture is sharper still: the IEA describes the market as "severely undersupplied" through Q3, with the Q2 deficit running as high as 6 million barrels per day. The full-year figure assumes Strait of Hormuz flows resume gradually from June.
None of this is "no one saw it coming." Analysts who watched the chokepoints — and the cumulative effect of a decade of underinvestment in upstream capacity — saw the fragility. The consensus didn't, because the consensus reads the futures curve, not the physical balance. That misreading is the first doom loop's first turn.
Loop 1 — Geopolitical leverage
The mechanic: a closure of a critical chokepoint tightens physical supply, which raises prices and widens benchmark spreads. Higher prices and wider spreads generate more revenue and more political leverage for the actor doing the closing. That reduces the incentive to deescalate.
How it's running right now: the 17 April ceasefire deal collapsed within hours when the US refused to lift the naval blockade on Iranian ports. Iran responded by reclosing the strait the same day and stating that Hormuz would remain under "strict management" of its armed forces until the US restored freedom of navigation for Iranian vessels. Over 230 loaded tankers are reported queued in the Gulf. The Iranian rial has hit a record low against the dollar; revenue is genuinely impaired; and yet, on week-on-week observation, Tehran's negotiating position has hardened rather than softened.
What makes it self-reinforcing: every week the strait stays closed, the precedent that the chokepoint can be closed strengthens. The next regional flare — a Houthi escalation, an Israel–Hezbollah second front, a sudden Russian–Turkish dispute over the Bosphorus — now has a working playbook. The loop doesn't need Iran specifically. It needs only the demonstration that closure works.
Loop 2 — Investment and supply
The mechanic: a decade of capital pressure — ESG mandates, transition uncertainty, post-2014 cost discipline — drove upstream operators to return cash to shareholders rather than reinvest. When a shock hits, there is no spare capacity to absorb it. Bringing capacity back takes time: measured in years for new fields, months for revived shut-ins. Recovery lags the shock by definition.
How it's running right now: in a textbook market, $107 Brent would trigger a wave of new drilling. The relevant operators are mostly not drilling. They are returning the windfall to shareholders and buying back stock. The Permian basin's plateau was already factored into pre-war forecasts; non-OPEC supply growth was set to decelerate sharply through 2027. The crisis has accelerated that, not reversed it.
What makes it self-reinforcing: when oil prices eventually soften — and Loops 1 and 4 will pull them down — operators remember the post-2014 collapse. They take cash, they don't drill. So when the next shock lands, spare capacity is again thin. The brittleness compounds. Each cycle leaves the system less able to absorb the next disruption.
This is the loop the public conversation least understands. It is also the loop that makes the 2026 crunch likely to repeat in 2028 and 2030.
Loop 3 — Refining and product
The mechanic: a closure of one corridor doesn't just affect crude; it disrupts the refined-product trade that runs through the same chokepoints. Cape of Good Hope rerouting adds 10–14 days to every cargo. Regional product premiums emerge as buyers compete for cargoes that have to physically arrive in time. The futures benchmark — Brent — describes a paper market; physical prices in specific regions decouple from it.
How it's running right now: the Suez Canal (5.5 mb/d of oil and products) has been operationally closed by Houthi attacks since late 2023; Bab-el-Mandeb (4.5 mb/d) is similarly degraded. The two corridors together carried most of the Middle East–Europe refined-product flow. As a result, Middle East jet-fuel arrivals into Europe fell from 330,000 b/d in March to 60,000 b/d in April — an 82% month-on-month collapse. Europe is currently running at roughly 70% of March's jet arrivals after partial replacement from Atlantic Basin and US Gulf sources. The ARA hub (Amsterdam–Rotterdam–Antwerp) reported jet stocks at a six-year low in the last reliable reading before the public reporting line went dark on 26 April. PCK Schwedt in Germany has been operating with 17% less crude since 1 May, after Russia halted Kazakh exports via the Druzhba pipeline.
What makes it self-reinforcing: regional premiums attract physical cargoes. NWE physical at €140 a barrel versus Brent futures at $107 doesn't equilibrate by some financial mechanism; it equilibrates by traders rerouting tankers from other regions toward Northern Europe. That drains the next region. The shortage migrates.
This loop is also why the futures price is misleading right now. The benchmark describes a forward contract for distant delivery in a deep paper market. It is not the price a refinery actually pays for a cargo arriving at Rotterdam this week.
Loop 4 — Demand destruction, recession, delayed recovery
The mechanic: high prices destroy demand. Asia has already cut more than 4 million barrels per day in April, mostly in price-sensitive sectors and emerging-market consumers. Lower demand briefly softens prices. Lower prices reduce the incentive for the investment that would have rebuilt supply. By the time demand returns, the supply hasn't.
How it's running right now: this is the loop currently doing the work the headlines describe as a pause in the crisis. It isn't stability; it's Loop 4 actively running. The pause is being cushioned by three temporary buffers — a surge in US exports into the Atlantic Basin, a Chinese pullback in physical buying, and heavy inventory draws. Each of those is a one-time mechanism, not a structural fix. The 246 million-barrel inventory draw in March and April cannot continue at that pace; commercial inventories have a floor.
What makes it self-reinforcing: a recession destroys demand for years, not months. If the current shock pushes a major economy into recession in late 2026 or early 2027, the demand cut becomes durable. Operators see the durable demand cut, defer investment further, and the supply side weakens at exactly the moment recovery would otherwise begin. The result is sticky energy inflation through the cycle, not a clean snap-back.
The four loops do not run in isolation. Loop 1 drives Loop 3; Loop 3 drives Loop 4; Loop 4 weakens Loop 2; Loop 2 makes Loops 1 and 3 more dangerous on the next pass. There is no single throttle to ease them. There is no political actor whose unilateral choice would unwind them. The loops have a logic of their own now.
What "the calm" actually is
Reuters this week described the oil market as in "deceptive calm." It is the right phrase, but the wrong frame. The market is not calm. It is mid-cycle.
What looks orderly on the screen is the visible output of three temporary cushions:
- US exports. Roughly 1 mb/d of new Atlantic Basin flow as US producers ship into the European arbitrage. This cushion runs as long as US production holds, which is structurally constrained.
- Chinese demand pullback. Strategic deferral of physical purchases as Beijing waits for the geopolitics to clarify. This cushion runs as long as Chinese policymakers tolerate the deferral.
- Inventory draws. The 246 million-barrel draw in March and April. This cushion runs until commercial stocks hit operational or regulatory floors — which is closer than the headline numbers suggest given the rate at which the draw has occurred.
None of those three is structural. The window between "the cushions hold" and "the cushions are exhausted" is not measured in years. It is measured in the inventory draw rate against the commercial floor, and at the current rate, it is measured in months.
That is what "deceptive calm" means in practice. Not stability. Pause.
What you should be watching
Three forward sequences worth reading the news against:
If Hormuz remains closed past the summer driving season, the consumer reckoning starts in July. Pump-price visibility lags wholesale by four to eight weeks. Whatever has happened to wholesale by Q3 will land on consumers in Q4. Watch fuel duty and excise policy in the major European economies for the first political signal.
If diplomatic channels open, expect temporary relief — but Loop 2 still binds. Supply doesn't return in the timeframe the market will initially price. Watch 2027 forecasts being revised down even on apparently good news. That is the loop telling you what the consensus is missing.
If a second chokepoint takes a serious hit — Suez fully closed beyond the Houthi disruption, the Turkish Straits caught in a Russia–NATO dispute, a Houthi escalation against Bab-el-Mandeb beyond current levels — Loop 3 cascades into a multi-corridor crisis. This is the scenario the IEA's worst-case is built around, and it is closer than markets are pricing.
Three indicators worth tracking, in this order:
- Brent prompt versus three-month spread. Heavy backwardation — front-month significantly above the three-month forward — is the textbook signal that physical scarcity is real, not just a paper effect. Track the Brent term structure week-on-week; widening backwardation means Loop 3 is biting harder.
- Cape of Good Hope tanker queue. Visible on AIS, leading indicator for ARA and Northwest European refining stress. The supply page tracks our chokepoint sea-state proxies; the deeper signal is freight rates and the queue itself.
- Regional physical premiums (Dated Brent, CIF NWE) over Brent futures. A reading more than 20% above futures is the "Loop 3 active" signal.
Don't focus on the Brent headline price. Focus on the spreads and the physical signals. The headline number is the loop's last reflector, not its leading indicator.
The bigger frame
Black swans appear suddenly. The systems that contain them get brittle slowly. The 2026 crunch is the first major test of the new energy stack — under-invested production, restructured trade flows after Russia, a climate transition that is underway but unfinished, and a geopolitical order in which the post-1991 chokepoint guarantees are no longer reliable.
The four loops above will produce more "deceptive calm" moments between now and 2027. The analytical work to do during those moments is to read them as the system pausing rather than recovering. The cushions are real but they are running. What replaces them — escalation, recession, or genuine policy response — is the question the next twelve months will answer.
We'll keep tracking the loops.
Sources: IEA Oil Market Report (May 2026); Reuters market commentary (14 May 2026); and AmericasOilWatch's own dashboards covering WTI and Brent prices, the Strait of Hormuz and Western Hemisphere chokepoints, and the Druzhba pipeline disruption at PCK Schwedt. Figures are quoted as they appear in source documents and were verified against primary sources before publication.